Jerome Powell brought reality to the market.
“The latest economic data have come in stronger than expected, which suggests that the ultimate level of interest rates is likely to be higher than previously anticipated,” Powell told the Senate Banking Committee in prepared remarks. “If the totality of the data were to indicate that faster tightening is warranted, we would be prepared to increase the pace of rate hikes.”
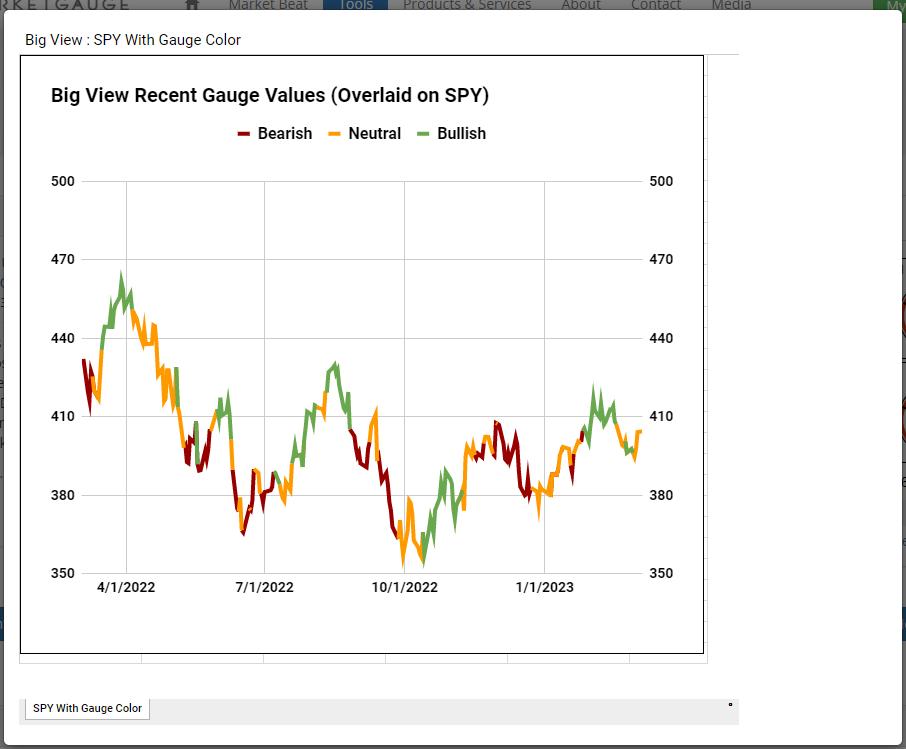
Powell noted that economic data from January on inflation, job growth, consumer spending, and manufacturing production have partly reversed course from the slowdown seen back in December. Interestingly, coming into today, the Sentiment Gauge flashed neutral.
Monday’s daily stated that “Looking at Granny Retail, that business cycle not only leaves investors with the trading range resistance, it also shows how the Retail sector could be a harbinger of worse times this spring.” We went on to say, “Granny Retail and Prodigal Regional Banks are my key go-tos for this week.”
So, will neutral sentiment go to bearish? And if so, what is next?Powell says he has no intention of raising the inflation target from 2%, but that could change–especially since CPI is still above 6%, and that number comes out next week.

With an inverted yield curve, a potential bottom in the long bonds, a stronger dollar, a persistent trading range and certain commodities still strong regardless (sugar, grains, crude oil, steel), the environment keeps screaming stagflation.
The chart of the long bonds (TLT) has a constructive exhaustion gap bottom in play. Since then, we have seen consolidation between 101-102.50. TLT is now outperforming SPY (Leadership), and the Real Motion indicator shows a positive divergence, as momentum is just under the 50-DMA while price is considerably below its 50-DMA.
Why would long bonds bottom? The long bond is just one part of the yield curve. It could mean that, while the short-term yields invert, the market is expecting a recession, hence a flight to safety in long bonds. We imagine that, should 20+ year bonds continue to go north, that too could be inflationary. TLTs have to get above the 50-DMA to get interesting.
Stagflation is Worst thing for the FED. A pause means inflation goes higher. But not pausing also means certain inflation beyond Fed’s control goes higher, given geopolitical and natural disaster potentials.
Raise rates higher and kill the economy.
For more detailed trading information about our blended models, tools and trader education courses, contact Rob Quinn, our Chief Strategy Consultant, to learn more.
IT’S NOT TOO LATE! Click here if you’d like a complimentary copy of Mish’s 2023 Market Outlook E-Book in your inbox.


“I grew my money tree and so can you!” – Mish Schneider
Get your copy of Plant Your Money Tree: A Guide to Growing Your Wealth and a special bonus here.
Follow Mish on Twitter @marketminute for stock picks and more. Follow Mish on Instagram (mishschneider) for daily morning videos. To see updated media clips, click here.
Mish in the Media
Mish focuses on defense stocks in this appearance on CNBC Asia.
Mish points out a Biotech stock and a Transportation stock to watch if the market settles on Business First AM.
Mish joins Maggie Lake on Real Vision to talk commodities and setups!
Read about Mish’s article about the implications of elevated sugar prices in this article from Kitco!
While the indices remain range bound, Mish shows you several emerging trends on the Wednesday, March 1 edition of StockCharts TV’s Your Daily Five!
Mish joins Business First AM for Stock Picking Time in this video!
See Mish sit down with Amber Kanwar of BNN Bloomberg to discuss the current market conditions and some picks.
Click here to watch Mish and StockCharts.com’s David Keller join Jared Blikre as they discuss trading, advice to new investors, crypto, and AI on Yahoo Finance.
In her latest video for CMC Markets, MarketGauge’s Mish Schneider shares insights on the gold, the S&P 500 and natural gas and what traders can expect as the markets remain mixed.
Coming Up:
March 8th: StockCharts TV’s The Pitch-a panel with Mish and 5 stock picks; also Investment Strategy Twitter Spaces with Wolf Financial
March 9th: Twitter Spaces with Wolf Financial
March 13th: Mish on TD Ameritrade with Nicole Petallides
March 14th: F.A.C.E. Forex Analytix with Dale Pinkert
March 16th:The Final Bar with Dave Keller, StockCharts TV
And down on the road
March 20th: Madam Trader Podcast with Ashley Kyle Miller
March 22nd: The RoShowPod with Rosanna Prestia
March 24th: Opening Bell with BNN Bloomberg
March 30th:Your Daily Five, StockCharts TV
March 31st: Festival of Learning Real Vision “Portfolio Doctor”
April 24-26: Mish at The Money Show in Las Vegas
ETF Summary
- S&P 500 (SPY): 390 support with 405 pivotal; 410 resistance.
- Russell 2000 (IWM): 190 failed, so Grandpa hurts–185 support.
- Dow (DIA): 326 support, 335 resistance.
- Nasdaq (QQQ): 300 the pivotal area 290 major support; 284 big support, 300 pivotal, 305 resistance.
- Regional Banks (KRE): 57 big support, 60 resistance.
- Semiconductors (SMH): 240 pivotal, 248 key resistance; 248 resistance, 237 then 229 support.
- Transportation (IYT): 240 resistance and 230 support.
- Biotechnology (IBB): 125-135 trading range.
- Retail (XRT): 66 pivotal with 64 key support.
Mish Schneider
MarketGauge.com
Director of Trading Research and Education

