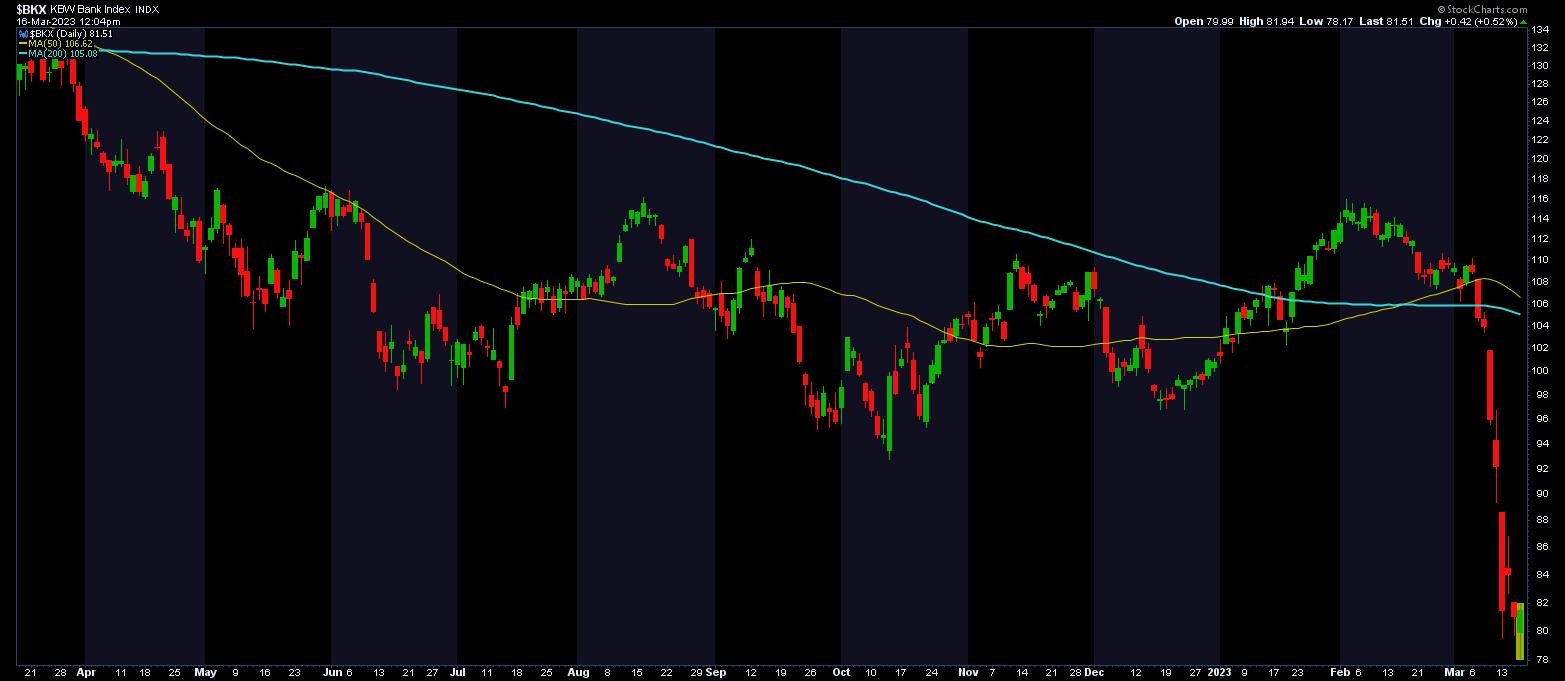
What a difference a day makes. So much for Tuesday’s relief rally in banks. The banking contagion continued with Credit Suisse’s fallout, which brought the banking fiasco to a global level. The domino effect was felt in the banking sector once again and continued into Thursday, with national and regional banks getting hit hard. One look at the chart of the KBW Bank Index ($BKX) will give you a good idea of how hard the banking sector was hit. As of Thursday morning, the large banks have lost about $165 billion in market cap. Ouch!

CHART 1: WHEN WILL BANK STOCKS REVERSE? Keep an eye on the KBW Bank Index ($BKX) for any signs of reversal.Chart source: StockCharts.com. For illustrative purposes only.
$BKX has a long way to go before coming close to its 200-day moving average, but what is more interesting is that the index started falling a few days before the Silicon Valley Bank news broke. It’s easy to say in hindsight, but if you had this index in one of your ChartLists, you might have noticed that it fell below its 200-day moving average on March 7, 2023. Silvergate was the first to collapse, but, because they were focused on cryptocurrencies, maybe investors thought it unlikely to spill over to other banks. Regardless, that move below the 200-day MA should have alerted you that something may have been brewing in the banking sector.
What the Regional Bank Crisis Mean for the Economy
Economic growth and banking performance are strongly correlated. In light of the selloff in the banks, along with the more recent inflation data indicating that inflation is cooling, will the Federal Reserve pause their interest rate hikes in their meeting scheduled for next week? The ECB raised interest rates by 50 basis points even after the Credit Suisse fiasco. Given that inflation is still a concern, it’s likely the Fed will raise 25 bps.
More importantly, what does the banking crisis mean for the overall economy? The implications are still uncertain. That’s because we are in an inflationary environment, and the Fed has stated that its objective is to bring inflation down to 2%. So, on the one hand, the Fed is fighting inflation without significantly slowing the economy, while, on the other hand, it’s trying to bring some stability to the financial markets.
It’s worth keeping an eye on ratios such as value vs. growth, small caps vs. large caps, stocks vs. commodities, and so on.
As long as the Fed is wrestling with monetary policy decisions, don’t be surprised to see more volatility in the stock markets. Rising interest rates, an inverted yield curve, and a slowing economy may have played a role in exposing some banks to additional risk. What does increased volatility mean for your portfolio? Should you be looking at growth or value stocks? Technology? Gold?
A volatile environment sends people to different asset classes. Gold prices have moved higher since the banking fallout, the Technology sector is another attractive opportunity, and investors are also turning to invest in Bitcoin. Remember, a volatile market means chasing different asset classes to make short-term returns. If that’s not your thing, you may be better off waiting for investor sentiment to settle before deciding where to invest. It’s worth keeping an eye on ratios such as value vs. growth, small caps vs. large caps, stocks vs. commodities, and so on.
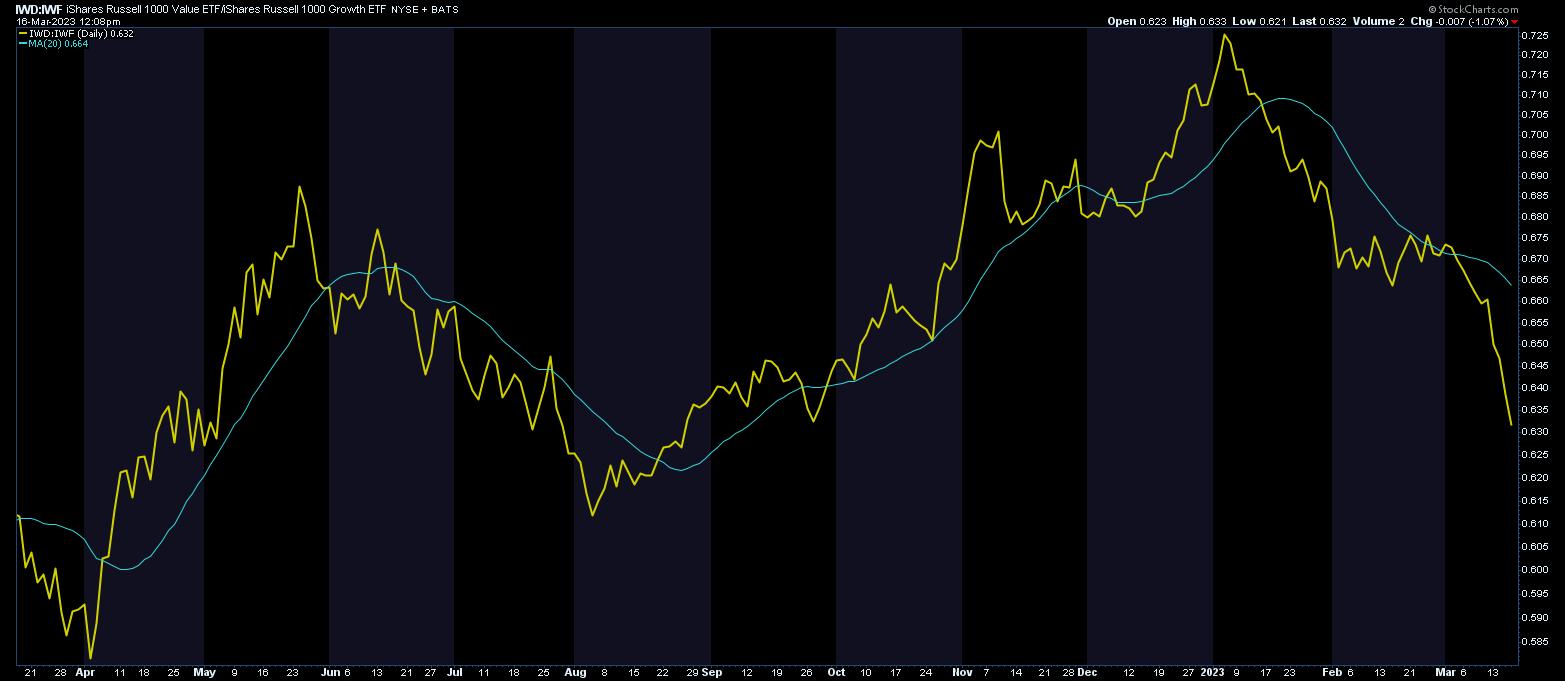
The chart below is of value vs. growth stocks. Notice that value stocks have had a steep decline with respect to growth stocks. Keep an eye out for a reversal with follow-through in this ratio.

CHART 2: VALUE STOCKS PLUMMET WITH RESPECT TO GROWTH STOCKS. Does it mean you should invest in growth stocks or something else? During uncertain times, investors move from one asset class to another, hoping to make short-term returns.Chart source: StockCharts.com. For illustrative purposes only.
Some of the large national banks are considered value stocks, and those could see some relief if the downfall is more focused on regional banks. Besides banks, homebuilders, communications networks, and semiconductor stocks make up many value stocks.
The regional bank crisis will likely spill over into homebuilders and real estate investment trusts (REITs). Remember, homebuilders and commercial developers depend on regional banks for loans. If the regional banks tighten lending, it could hurt these industries. On the other hand, lower mortgage rates could help the housing market, but it remains to be seen if the demand will be enough to support homebuilders.
Following Market Breadth
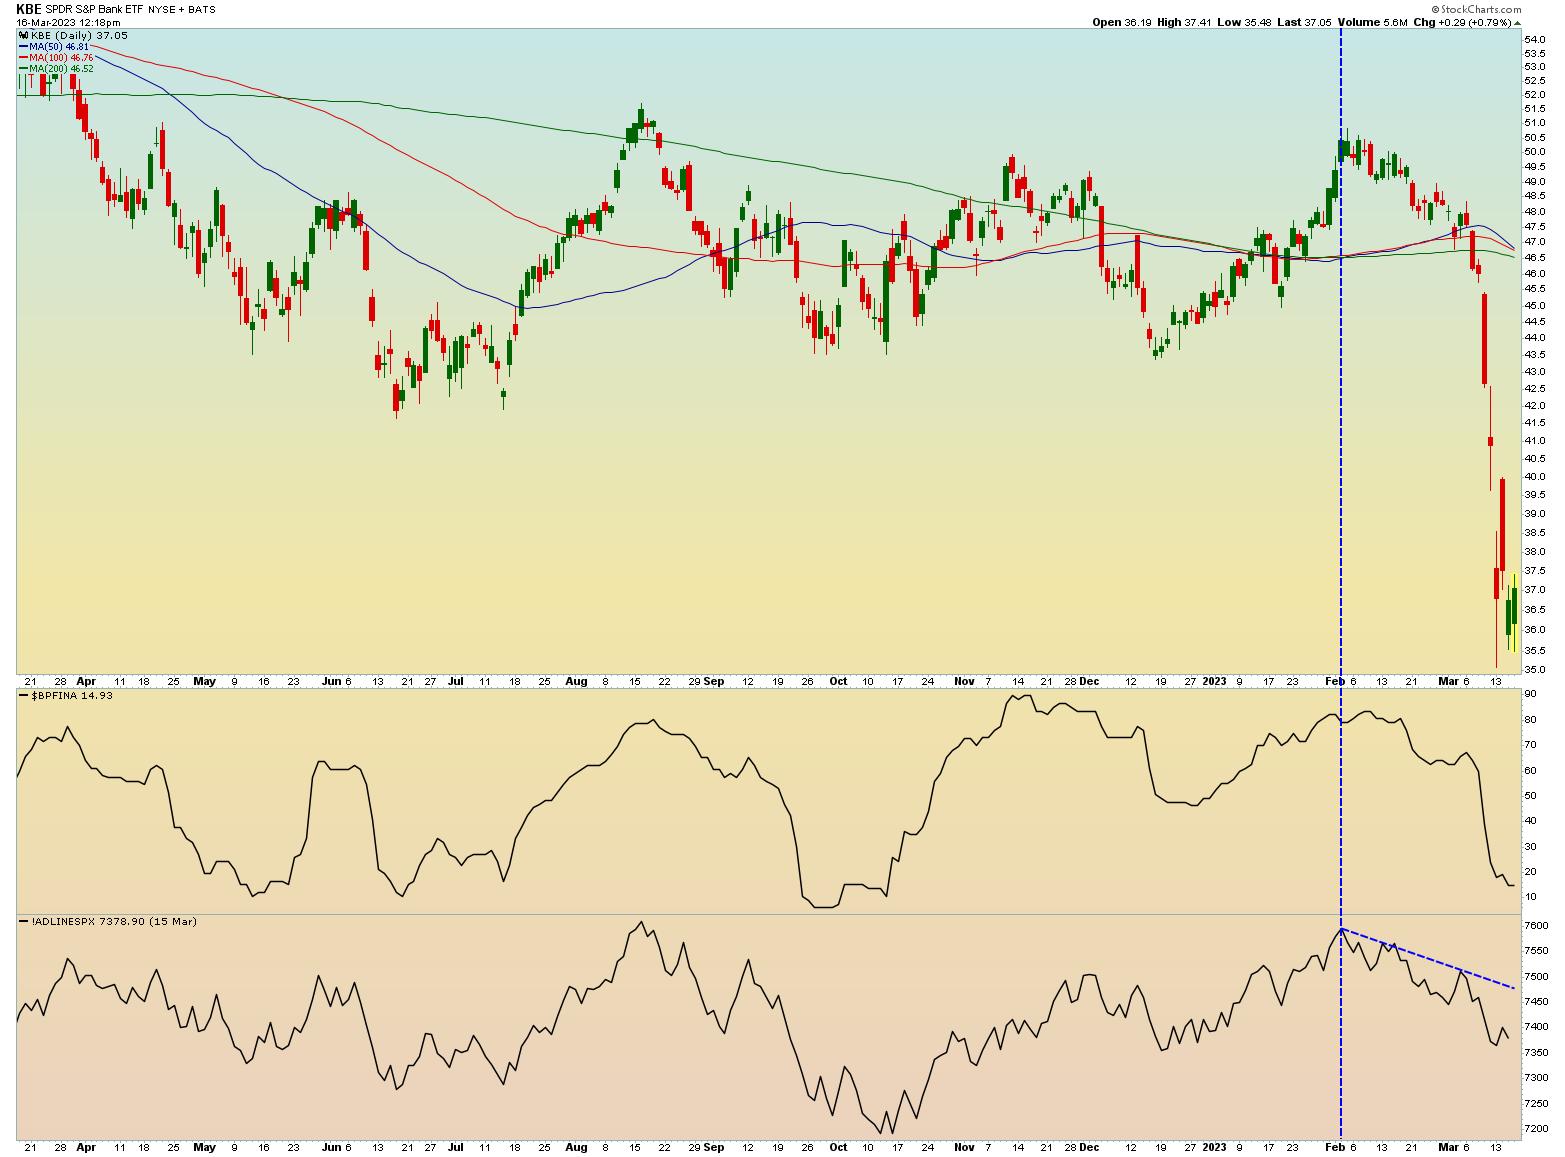
A bigger concern is when banks will start turning around. It’s something to watch, because you could pick up some bank stocks at bargain prices. Two charts to add to your ChartLists would be the SPDR S&P Bank ETF (KBE) and the SPDR S&P Regional Banking ETF (KRE). Let’s focus on KBE, since that encompasses the larger banks, which could see relief quicker than the regional banks.
The chart below analyzes the market breadth of KBE. Market breadth indicators are great at showing when investor sentiment may have changed. StockCharts has a collection of market breadth indicators that can be used for various sectors or the overall market. The bullish percent index of the financials and the advance-decline line are just two out of a long list.

CHART 3: GETTING A SNAPSHOT OF MARKET INTERNALS. Market breadth indicators help identify changes in investor sentiment. Here, two market breadth indicators are applied to the chart of the SPDR S&P Bank Index (KBE).Chart source: StockCharts.com. For illustrative purposes only.
The S&P Financial Sector Bullish Percent Index ($BPFINA) has fallen in step with the SPDR S&P Bank ETF (ticker: KBE) and is well below 30%. This indicates widespread weakness in the Financial sector. It’ll have to turn, move above 30%, and follow through to show a change in investor sentiment. Remember, the bullish percent index is an indicator based on point and figure charts. That means that any rally attempts will have to form higher highs before the bullish percent index reverses.
Another indicator added to the above chart is the advance-decline line. Since the big banks and some of the regional banks tend to be large-cap stocks, you could apply the SPX Advance-Decline line to analyze the banking sector. This line also trending lower, suggesting that there continues to be broad participation in the market decline. More interesting is that, since early February, this line has been trending lower. Try out different market breadth indicators with different sectors to identify which sectors are reversing and which ones are trending. In a volatile market, it’s best to keep an eye on all market sectors.
The Bottom Line
It’s only natural for investors to be reminded of the 2008 crisis and think that the regional bank fallout could elevate the possibility of a recession. But that depends on the depth of the financial stress, which will unravel over time. So, let’s hope this banking crisis is more controlled and the damages are short-lived. In the meantime, be prepared for more volatility.

Disclaimer: This blog is for educational purposes only and should not be construed as financial advice. The ideas and strategies should never be used without first assessing your own personal and financial situation, or without consulting a financial professional.

